Analytics
The Analytics page in the Hub turns a day’s worth of recordings, counts and region detections into a handful of KPI cards, hourly charts and drill-down tables. It is the page you open when you want to answer questions like “how many people did camera 3 count this afternoon?” or “which devices were online today and how many recordings did they produce?”.
The page is reachable from the main sidebar under Analytics and
serves the route /analytics.
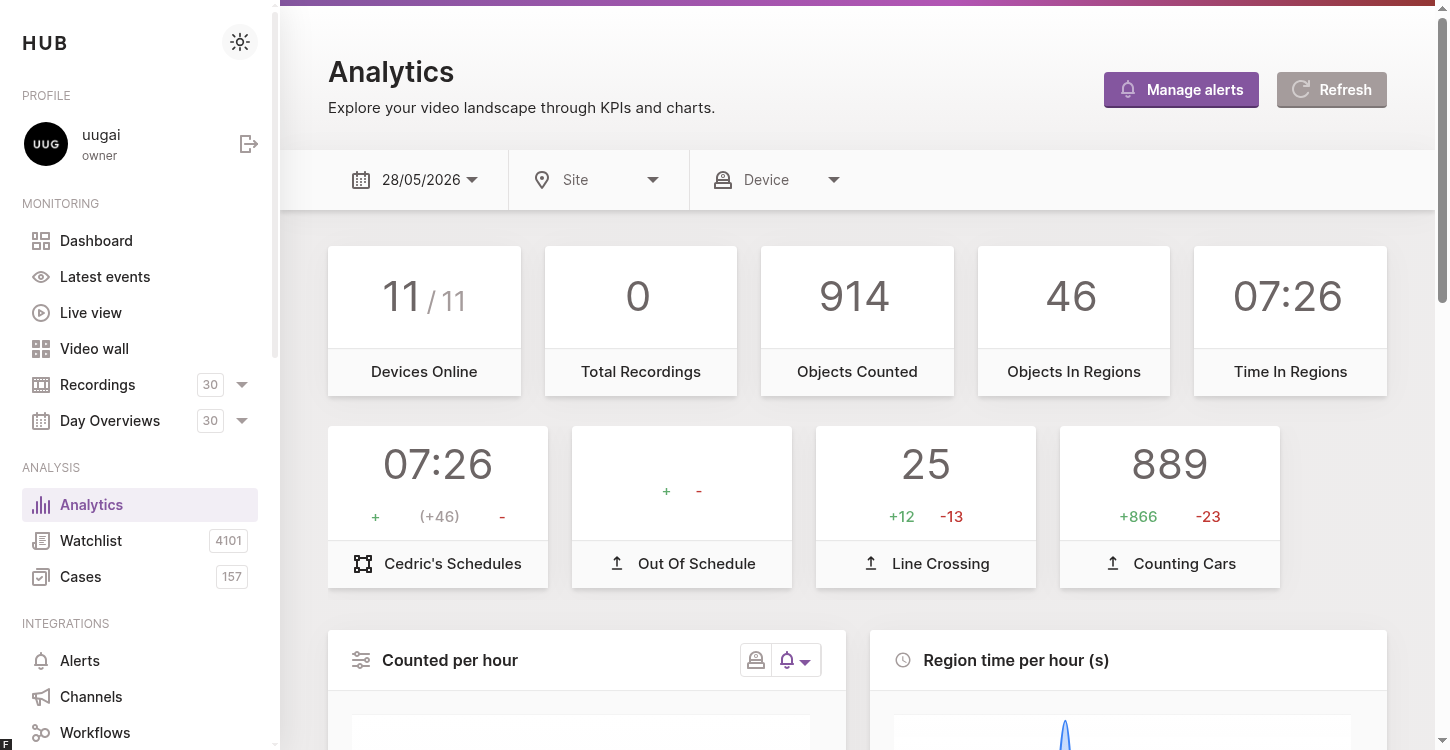
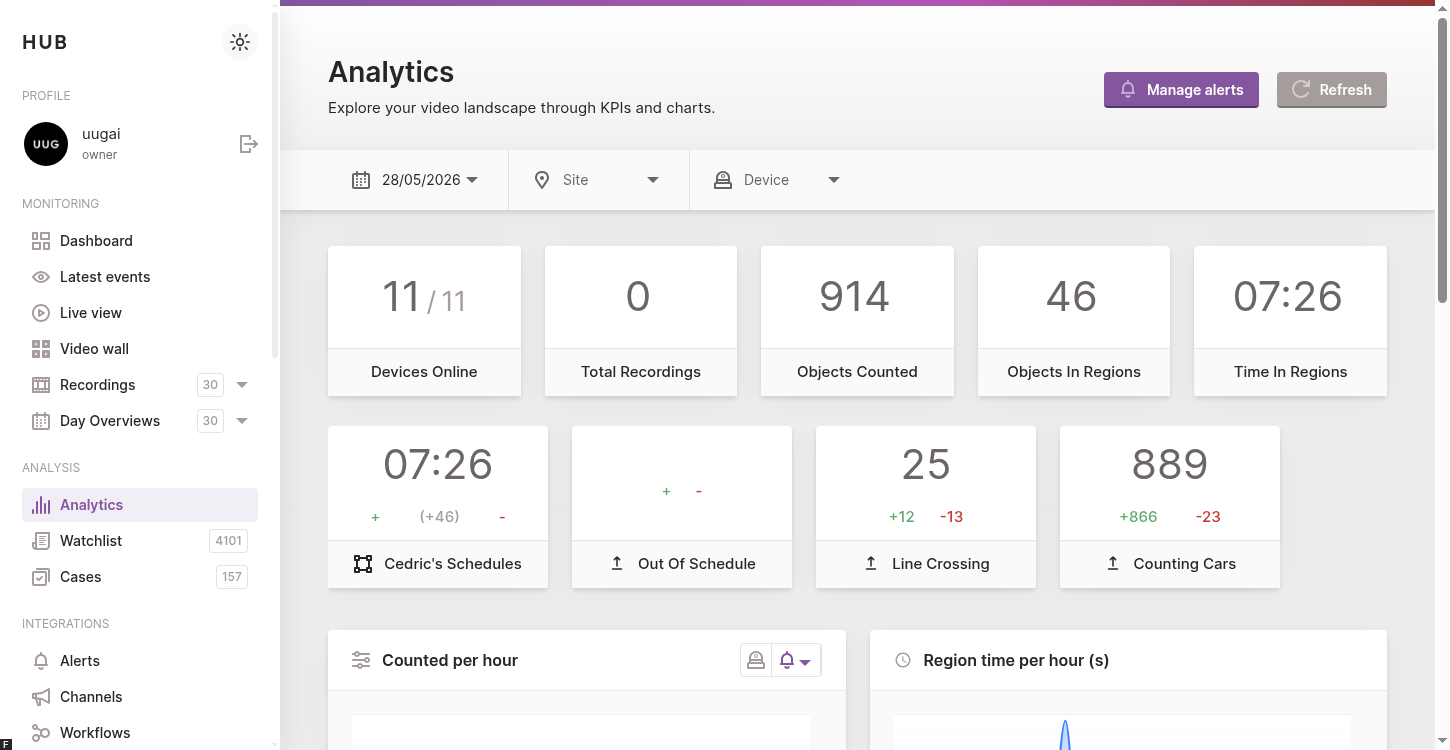
The Analytics page consolidates a single day’s KPIs, hourly charts and per-event tables. Filter the day, the sites and the devices at the top, then read the cards and charts top to bottom.
How it works
Analytics is not a separate ingestion path: it is a read-only view on top of the data the Hub pipeline already produces.
- Recordings are uploaded to the Vault by the agent and
registered in the Hub database by
hub-api. - Counts and region detections are produced by the
hub-pipeline-analysisservice when an alert of typecounting_line,counting_regionormultimatches an object track on a recording. - The Analytics page aggregates those rows for the selected day, sites
and devices, and asks
hub-apifor hourly buckets to feed the charts. No new analytics are computed at view time — flipping the filters only re-queries the existing data.
The set of KPIs and the hourly buckets you see on this page therefore exactly mirror what your alerts have produced and what your devices have uploaded. If a KPI stays at zero, the most common cause is either “no alert is configured for this device” or “no recording was uploaded for the selected day”.
Walkthrough
Filtering the day, sites and devices
The top control bar scopes every KPI, chart and table on the page. Three filters cooperate:
- Date picker — pick any day for which at least one recording was uploaded. Days without data are disabled.
- Sites multi-select — restrict the view to one or more sites.
- Devices multi-select — further restrict by individual camera.
All three filters re-query the data in place; no full page reload is triggered.
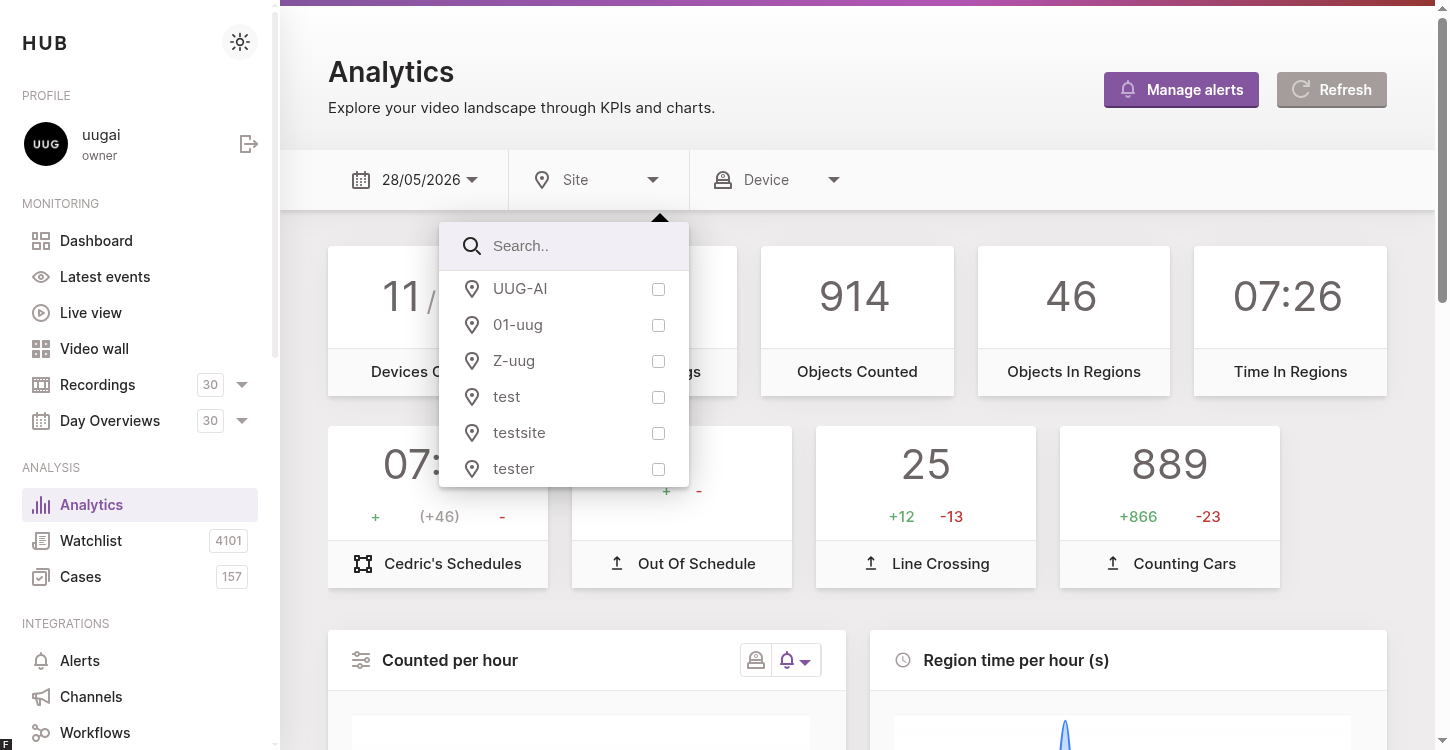
The control bar at the top of the page scopes every KPI and chart below it. Sites and Devices are independent multi-selects, so you can mix a whole site with a single device from another.
KPIs at a glance
A 5-card strip summarises the selected day:
- Devices online — the number of agents that were connected during the day.
- Total recordings — the number of recordings uploaded for the selected scope.
- Objects counted — the total of every
counting_linealert. - Objects in regions — the total of every
counting_regionalert. - Time in regions — the cumulative dwell time matched by
multiregion alerts, formatted asHH:MM:SS.
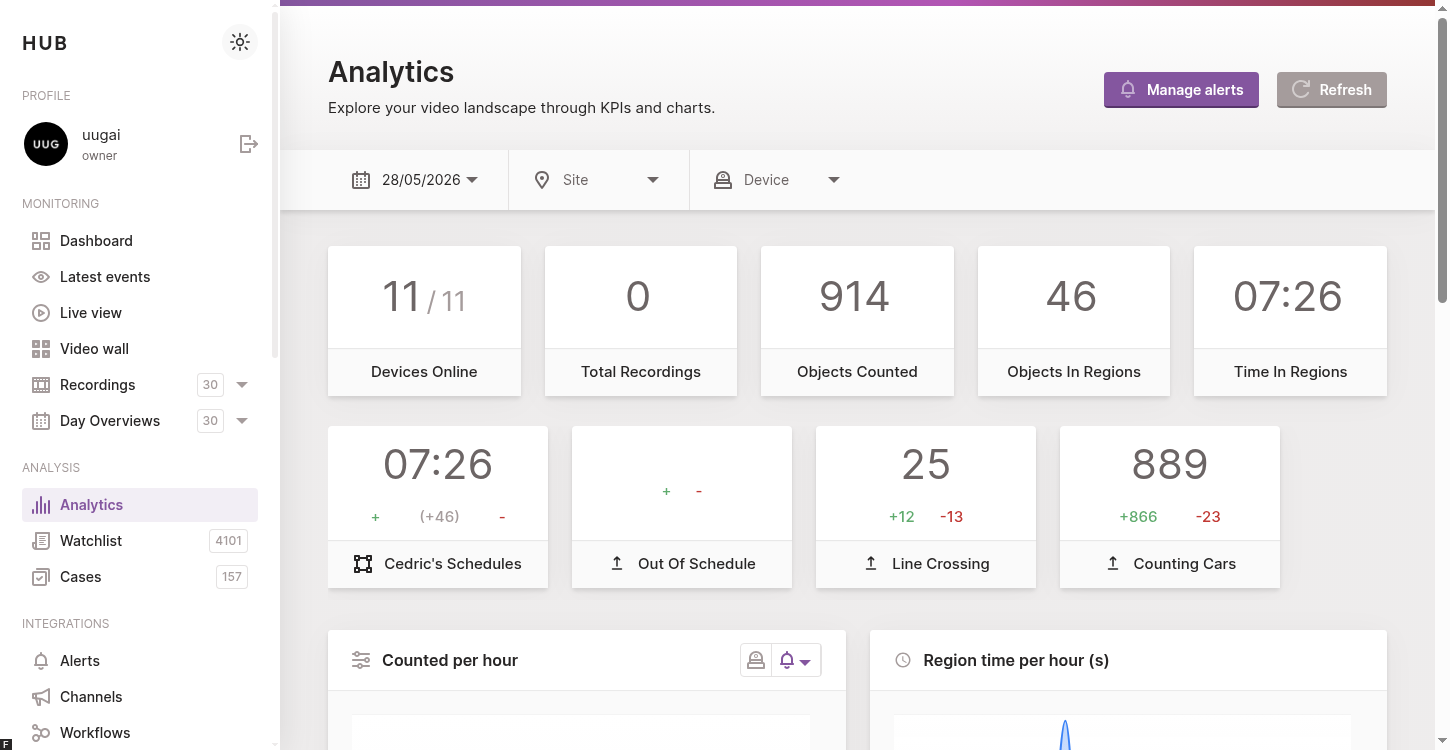
The KPI strip is the fastest way to spot an outlier day. Each card responds to the date, sites and devices filters.
Per-alert track
Below the KPIs, every alert that fired at least once on the selected day gets its own card on the alert track. The visual depends on the alert type:
counting_linecards show the in / out split next to the total.counting_regioncards show the dwell time and the number of objects that entered the region.multicards combine both — directional counts and cumulative time in the region.
When no alert is configured (or none fired), the track is replaced by a placeholder that links straight to the Alerts section so you can configure one.
Hourly charts
Two side-by-side charts break the day down into 24 hourly buckets:
- Counted per hour — switch between per device (one series per
camera) and per alert using the camera / alerts toggle in the top
right of the block. The alert series can additionally be filtered
by direction (
all,in,out). - Region time per hour — total seconds spent in any region per hour, broken down by camera.
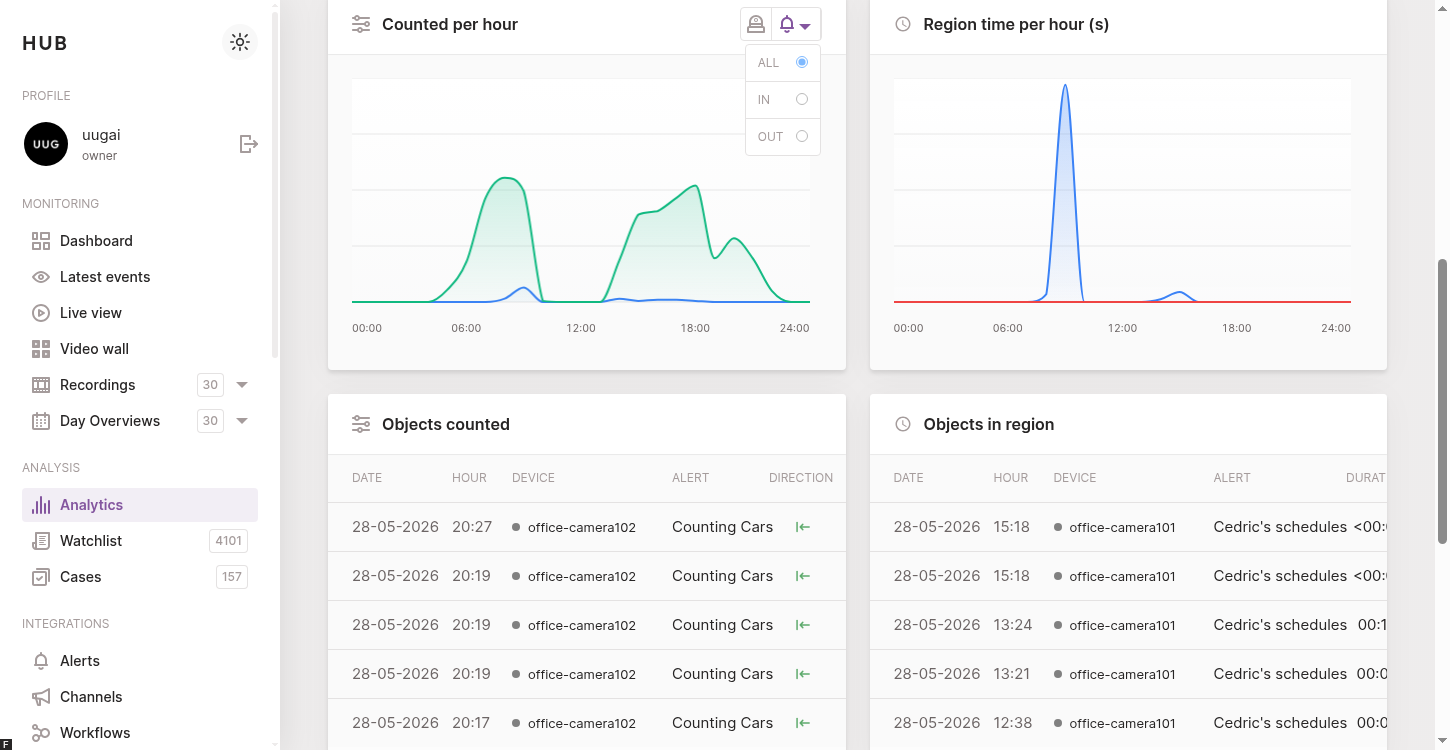
The Counted per hour chart toggles between a per-device and a per-alert breakdown. The arrow next to the alerts toggle opens a direction filter (all / in / out).
Count and region tables
Two tables below the charts list the individual events behind the totals: every counted object (with date, hour, device, alert and a direction arrow) and every region detection (with the same columns plus the dwell duration). Clicking a row navigates to the underlying recording so you can replay the moment that triggered the count.
Recordings per hour
The final block plots the number of recordings uploaded per hour for the selected scope. Use it to correlate spikes in analytics with the volume of footage your agents actually pushed up.
Recordings per hour reflects what the agents uploaded, regardless of whether an alert matched. A flat line here usually means the cameras were offline, not that the analytics are broken.
Permissions and roles
Analytics is a read-only view. Any user with access to the parent site can open the page; the result set is automatically scoped to the devices that user is allowed to see (same scoping as the Live view and Recordings pages).
The Manage alerts button in the breadcrumb only navigates — it
does not grant access. Editing alerts still requires the
alerts permission; see the
roles documentation for the full
matrix.
Configuration
Analytics has no dedicated configuration of its own. The data it visualises is produced by the alerts engine and the analysis pipeline, which are configured per Helm chart value:
# helm-charts/charts/hub/values.yaml
hubPipelineAnalysis:
  enabled: true       # required to populate Objects counted /
                      # Objects in regions / Time in regions
If hubPipelineAnalysis is disabled in the deployment, the
Total recordings and Recordings per hour widgets still work
(they only need recordings), but every other KPI stays at zero.
Troubleshooting
- Every KPI is zero. Check that at least one alert is enabled for the selected site / device and that recordings were uploaded that day. The KPI strip never back-fills counts retroactively.
- The date picker only lists a single day. The picker is fed by the days for which the Hub has indexed recordings. A brand-new account or a long offline period will collapse the picker to today’s date.
- Charts show “No chart data” but the KPIs are non-zero. The totals come from a different aggregation than the hourly buckets. This usually means the per-hour query timed out — refresh the page with the Refresh button in the breadcrumb to retry.
- A count row is missing from the table but the KPI counts it. The tables are paginated server-side; the KPI counts everything, the table only shows the first page. Narrow the filters or use the Recordings page to find the specific event.